← Portfolio
Matthews' Liquor Pty Ltd · 2019
Weekly Performance Dashboard (Power BI)
Power BIExcel VBAPostmanData Visualization
Live Dashboard
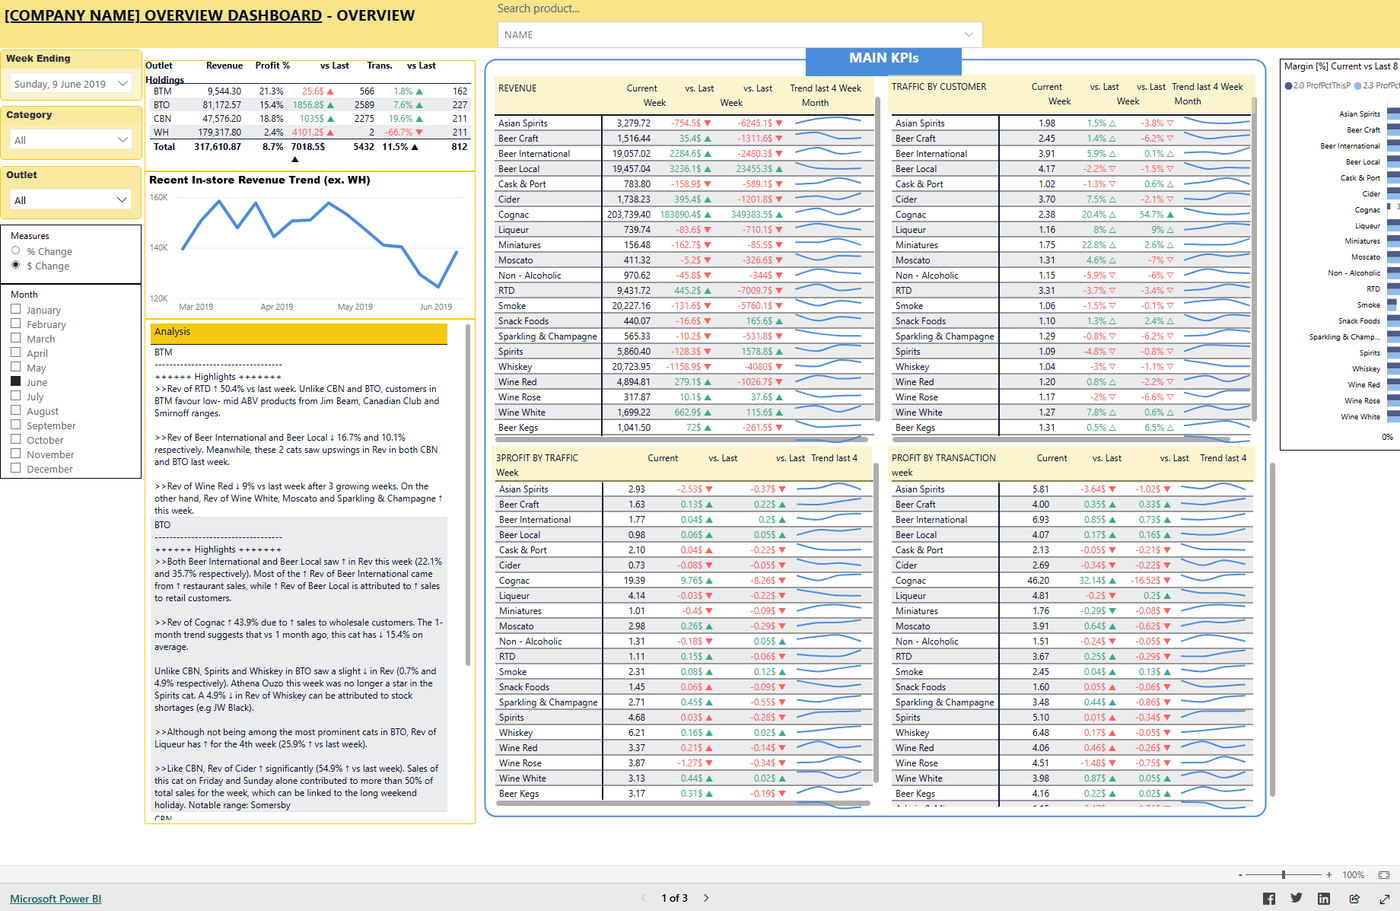
A self-serve weekly performance dashboard built in Power BI, giving management drill-through visibility into revenue, margin and slow-moving stock across a multi-store liquor retail operation.
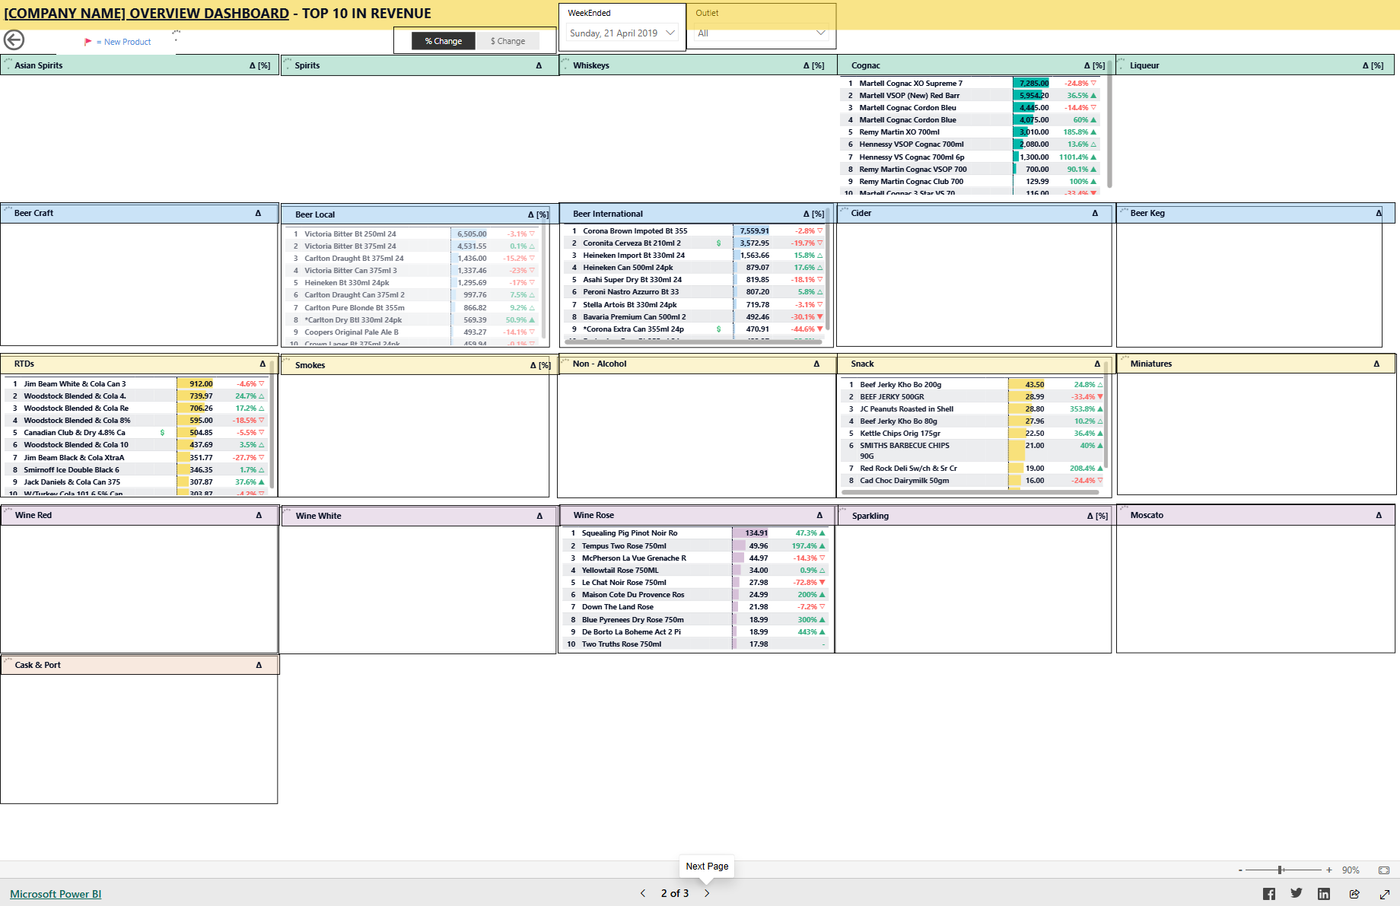
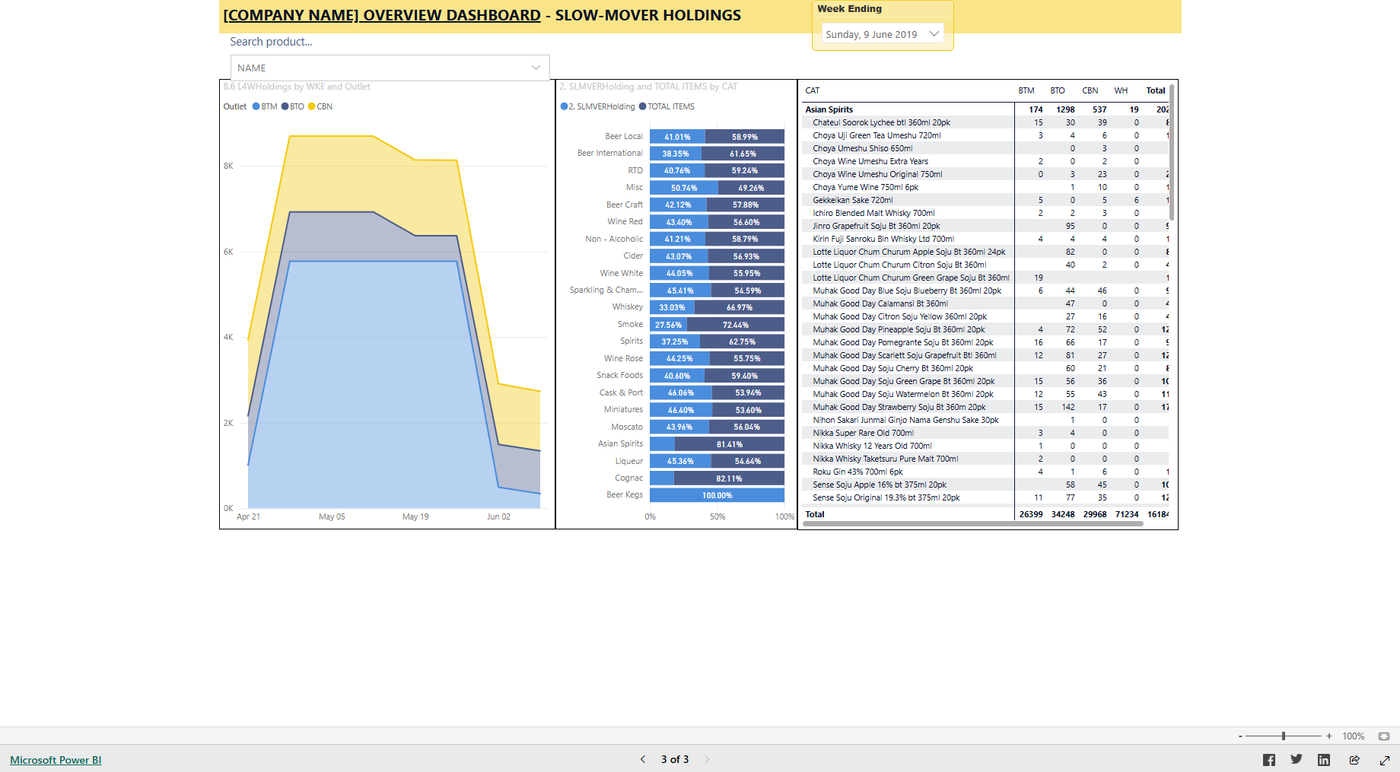
Designed and built the reporting layer end-to-end: category-level KPIs (revenue, profit %, traffic, margin) with week-over-week and trailing-4-week trend sparklines, a top-10-in-revenue breakdown by category, and a slow-mover holdings view surfacing at-risk stock by outlet. Data was assembled via Excel VBA macros and the Postman API client, then modelled and published in Power BI so the management team could self-serve without manual reporting effort.
Artifacts